Formal guarantees about programs come with fine print: they are only as solid as the assumptions and mechanisms behind them. Formal robustness guarantees about neural networks are no exception. Much of my recent work seeks to understand how those guarantees can be undermined, and what it takes to make them solid, as described in my Verified Certified Robustness series of posts. That series explains how robustness guarantees can be undermined by bugs in the mechanisms that check them, which we addressed with formal verification, and by floating-point rounding that the theory behind them ignores, which our recent work accounts for with new theory. In both cases, the danger is that a robustness checker says that a model is robust when in fact it is not.
A recent workshop paper by Minh Le and Phuong Cao examines a danger of a different kind, arising from the random seed used during training. The seed shapes the model that training produces. Even so, it cannot make a (sound) robustness checker’s verdict false: a model that owes its robustness to a lucky seed is still robust. What the seed might instead undermine is how well robustness measurements support the conclusions we typically draw from them. A robustness measurement is made on one particular trained model, but is usually read as saying something more general about the method used to produce that model: that the method yields robust models, say, or that it improves on a competing method. Conclusions like those require measurements that generalise beyond the particular model that was measured.
That is the danger their paper reports. Its title speaks of the extreme variance of certified robustness: neural networks that differ only in their training seed, they find, can differ wildly in how many of their predictions can be certified robust. Their headline number is striking: on MNIST, models whose ordinary accuracy varied by just 0.057 percentage points showed a standard deviation of 28.9 percentage points in certified robustness. From this they worry that reported improvements in certified robustness—which are typically smaller than that—“are likely unconvincing”, and that this means there could be “serious doubts about the trustworthiness of certified robust models”.
Those doubts caught my attention, because our recent paper reports certified robustness numbers of exactly the kind in question, measured (as is common) from a single trained model per configuration. If Le and Cao’s finding transferred to our setting, then our numbers—and everyone else’s—would deserve error bars wide enough to swallow the results. But there is a mismatch: our models, like those throughout the literature that their conclusion concerns, are trained to be robust, while the models in their experiments were not. This post reports experiments that test whether the variance they observed is also present for robustly trained models. The short answer is that it does not appear to be.
What They Measured
Le and Cao trained ten small ResNet models on each of two datasets (MNIST, plus a binary Mars-frost-identification task from NASA JPL), with the ten models differing only in their training seed. They then used the α,β-CROWN verifier to check, for each of the first 100 test inputs, whether the model’s prediction is certifiably robust: whether it provably cannot be changed by perturbing the input by more than some small amount ϵ (measured, in their experiments, in l∞ distance). The fraction of inputs passing that check is what Le and Cao call the model’s certified robustness1, and its variance across the ten seeds is the finding this post concerns. Their paper reports other findings too—for instance, on whether a “lucky” seed’s certified robustness on one test set carries over to another—and I return to that particular question briefly below.
The variance they measure is indeed large. And their broader recommendation—that papers reporting certified robustness should report confidence intervals—is one I have no quarrel with. Le and Cao also describe their paper as presenting preliminary work, and I have no wish to hold a preliminary paper to a standard it doesn’t claim. Their headline conclusion, though, reaches beyond what their experiments measured, in a way that seemed to me to be worth testing. The 28.9 point standard deviation was measured on models trained with standard cross-entropy training, which makes no attempt to produce robust models. But the reported improvements it is compared against come from papers presenting methods designed to produce provably robust models—almost all of them training methods or architectures built for robustness, and all of them evaluated on models trained to be robust. In other words, seed-to-seed variation in models never trained for robustness is being compared against robustness gains measured on models that were. (The comparison involves other potential confounders too—different perturbation sizes, different datasets, 100 test inputs versus full test sets—but the training mismatch is the one that matters most.)
Why Standard Training Maximises the Variance
Two ingredients combine to produce their dramatic numbers, and both are consequences of the experimental setup rather than of certified robustness itself.
The first is that, for a standard-trained model, certified robustness is a property the training never asked for. As Le and Cao note, it is well documented that properties a training objective doesn’t constrain are precisely the ones that vary freely between retrainings: equally-accurate models can differ substantially in accuracy under distribution shift, in performance on particular subgroups of the data, even in how well calibrated their predicted probabilities are on data from sources not seen during training—a phenomenon known as underspecification. Seed variance in an un-optimised property is unsurprising, indeed expected.
The second ingredient is the perturbation sizes ϵ at which they measure robustness. Every test input x has some maximal perturbation size ϵmax,x at which it can be certified as being robust, and the model’s certified robustness at a given ϵ is simply the fraction of inputs x for which ϵmax,x exceeds ϵ. Standard training leaves those per-input maxima ϵmax,x tiny and bunched together, so small changes to the model shift many inputs across any threshold placed among them. You can see this in the paper’s own tables: their mean certified robustness on MNIST falls from 81.6% to 22.3% as ϵ moves from just 0.006 to 0.008. Their ϵ values sit exactly on that transition: their methodology explains that the ϵ range was chosen so that mean certified robustness spans from high to low across it. (The same ϵ values appear in the first version of their paper, which studied a different question: how pruning affects the verifiability of these same networks.) Measuring a bunched-up quantity at its most sensitive point is a recipe for large variance. This is true for any property, whether robustness or otherwise.
Here are those numbers as a picture, with the line tracing their reported mean certified robustness across their ten seeds, and the shaded band showing its reported variance:
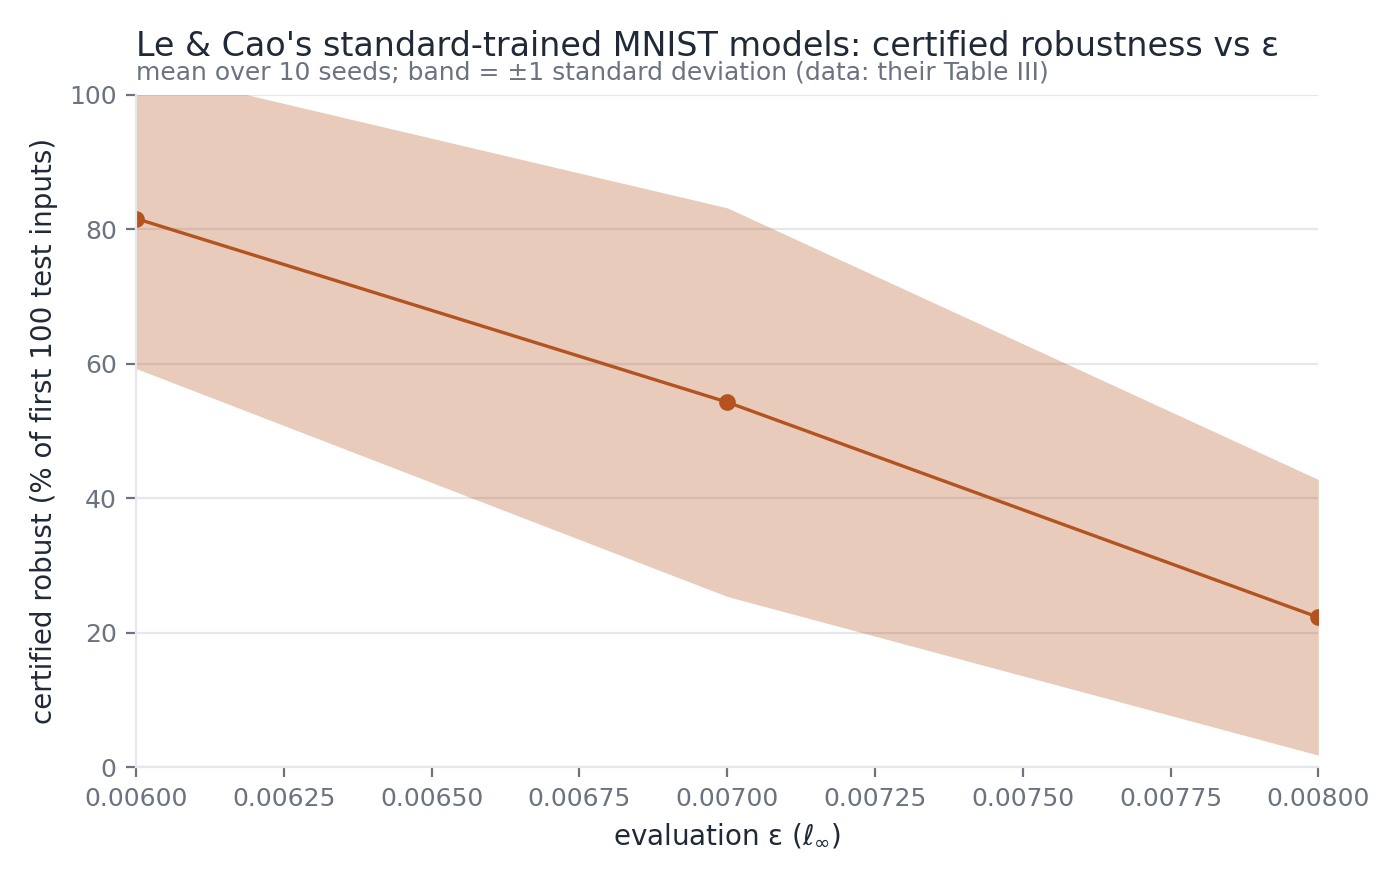
(The band shows ±1 standard deviation around the mean. It is clipped at 100%, since one standard deviation above their ϵ = 0.006 mean exceeds what is possible.)
So their experiments leave untested the question on which their headline conclusion depends:
does certified robustness still vary extremely across seeds when the model is trained for the robustness being certified?
By “trained for the robustness being certified” I mean not only that some kind of robust training method was used to train the model, but that the value of ϵ that certified robustness was then measured at was consistent with how the model was trained. For most robust training methods, this means measuring certified robustness at ϵ values of the same order as those used in training.
Measuring the Variance for Robustly Trained Models
Answering that question turns out to be cheap. We took globally-robust (GloRo) training—the certified training method of Leino et al. that my earlier posts describe—and trained ten models per configuration, using seeds 10 through 100 in steps of 10, mirroring Le and Cao’s design. We evaluated certified robustness2 on full test sets rather than 100 inputs. And, like Le and Cao, we measured at a range of ϵ values, spanning from well below each model’s trained-for perturbation size to well beyond it. We did this for two tasks:
- MNIST, the dataset behind their headline number, using the exact training configuration of the MNIST model from our CAV 2025 paper: a dense (i.e. fully connected) network with eight hidden layers, trained against perturbations of size ϵ = 0.45 in Euclidean distance but designed to be certified at ϵ = 0.3 (training against a larger ϵ than one intends to certify is common practice for GloRo models), evaluated on all 10,000 test inputs. We measured at ϵ values from 0.1 to 1.0.
- HIGGS, a tabular binary physics classification task from our recent paper—a structural analogue of Le and Cao’s binary Mars frost task—trained and designed to be certified at the same ϵ = 0.1, evaluated on all 500,000 test inputs. We measured at ϵ values from 0.02 to 0.3.
A reader might wonder why we did not instead rerun Le and Cao’s own architecture and tasks with robust training. I return to that question, and to whether the differences are likely to matter, towards the end of this post.
What We Found
The results are below, for MNIST first and then HIGGS. In each plot the line traces the mean certified robustness across the ten seeds, and the shaded band spans the minimum to the maximum—the entire spread that seed selection produced.
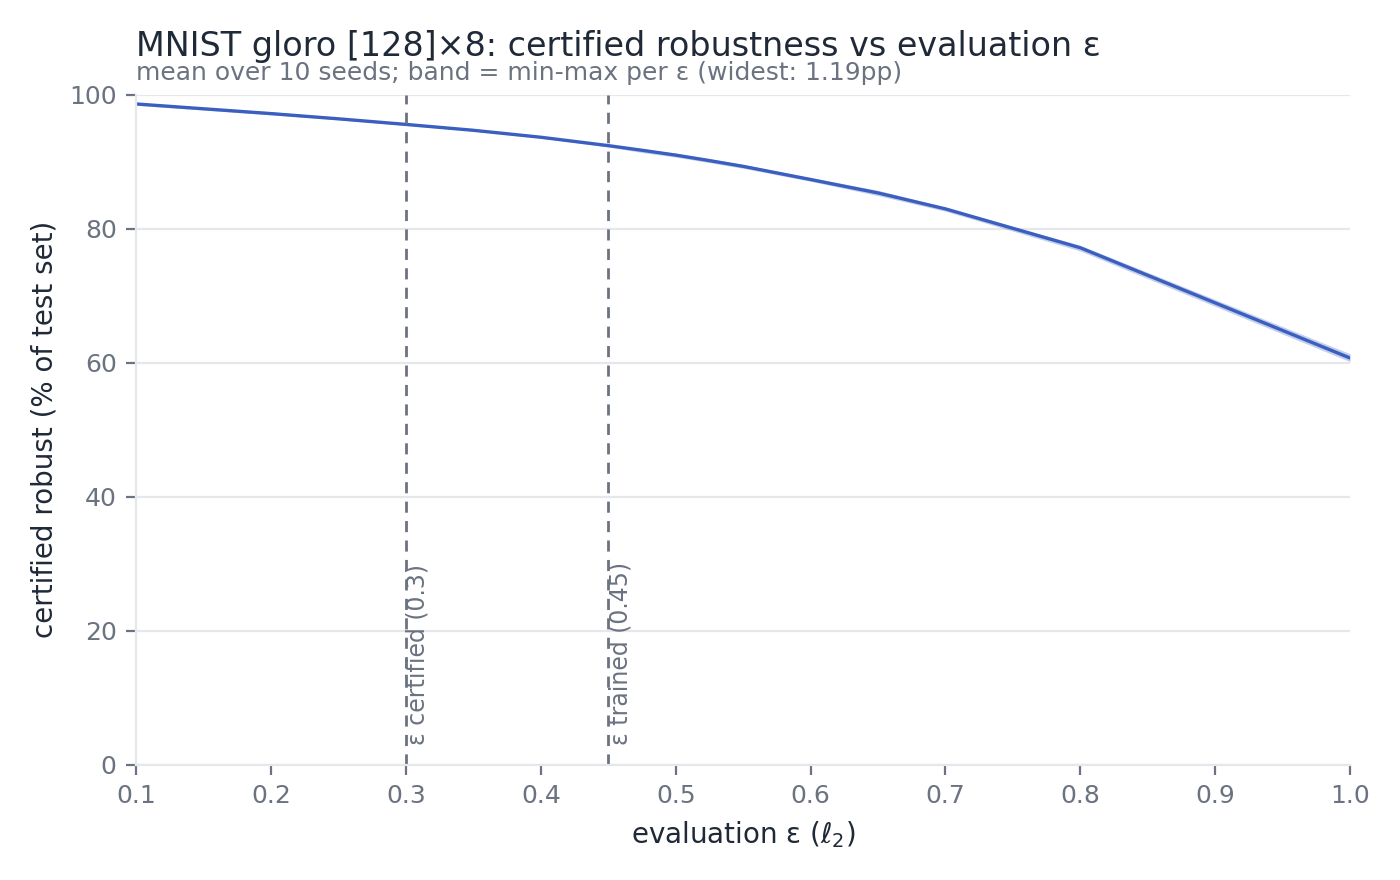
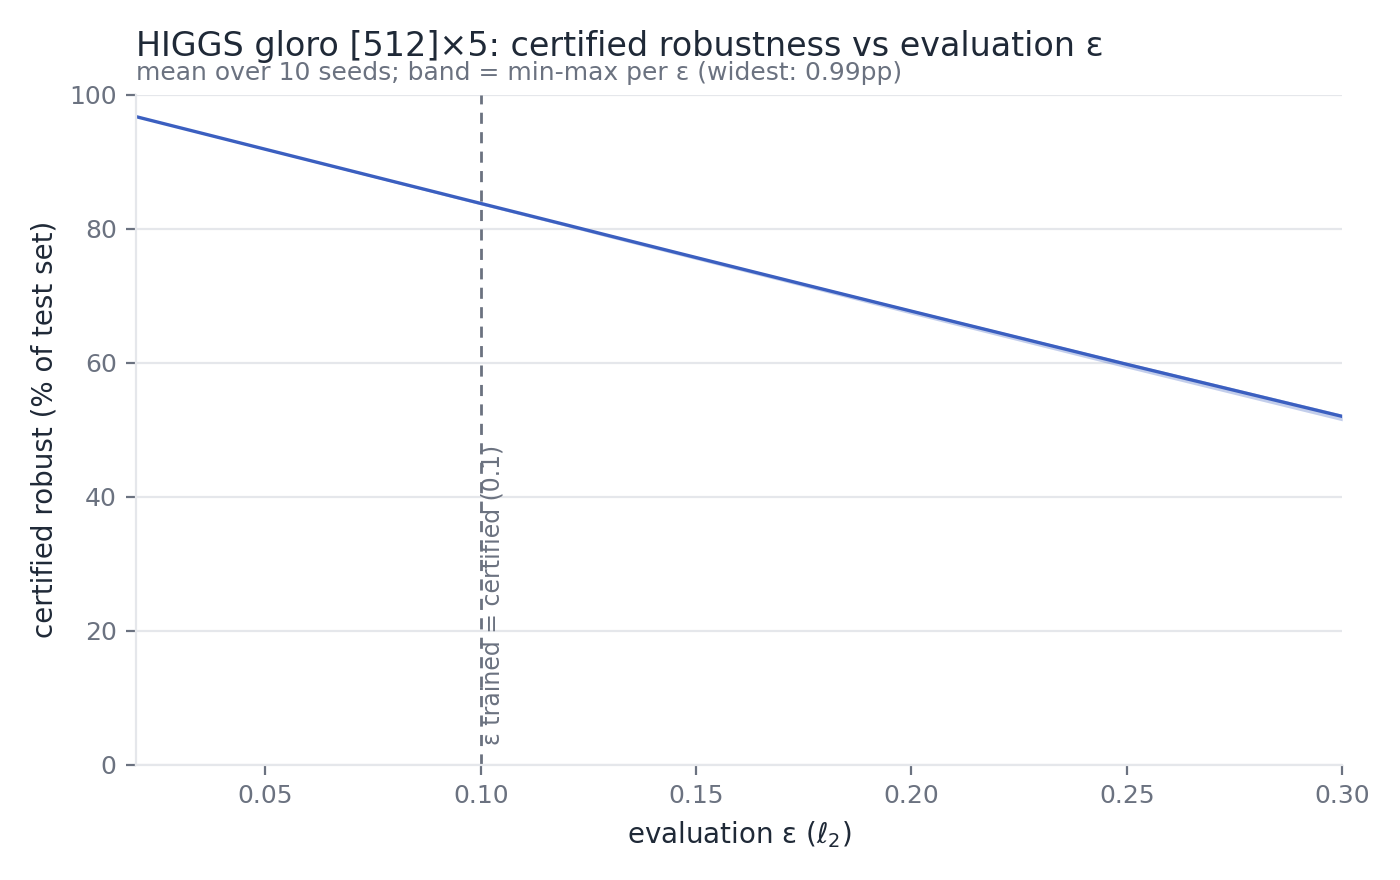
The way to read these: there is no ϵ at which the seeds disagree visibly. The band is narrower than the line everywhere, including at perturbation sizes twice what the models were trained for, where certified robustness has fallen to 60% and below. The decline is smooth, with no cliff hiding just past the trained-for ϵ. To make the spread visible at all, here are the same plots with the vertical axis zoomed to the data:
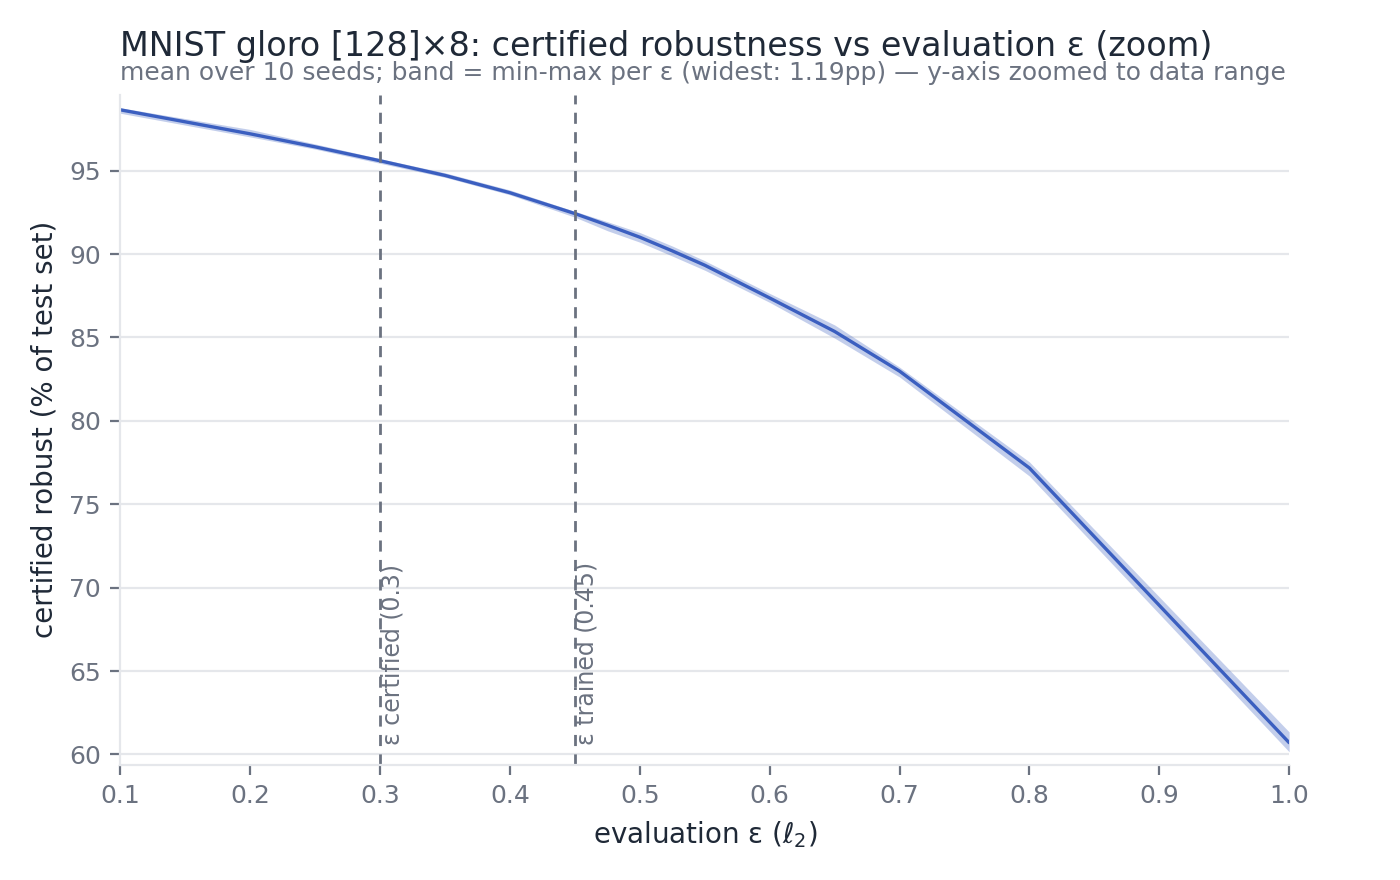
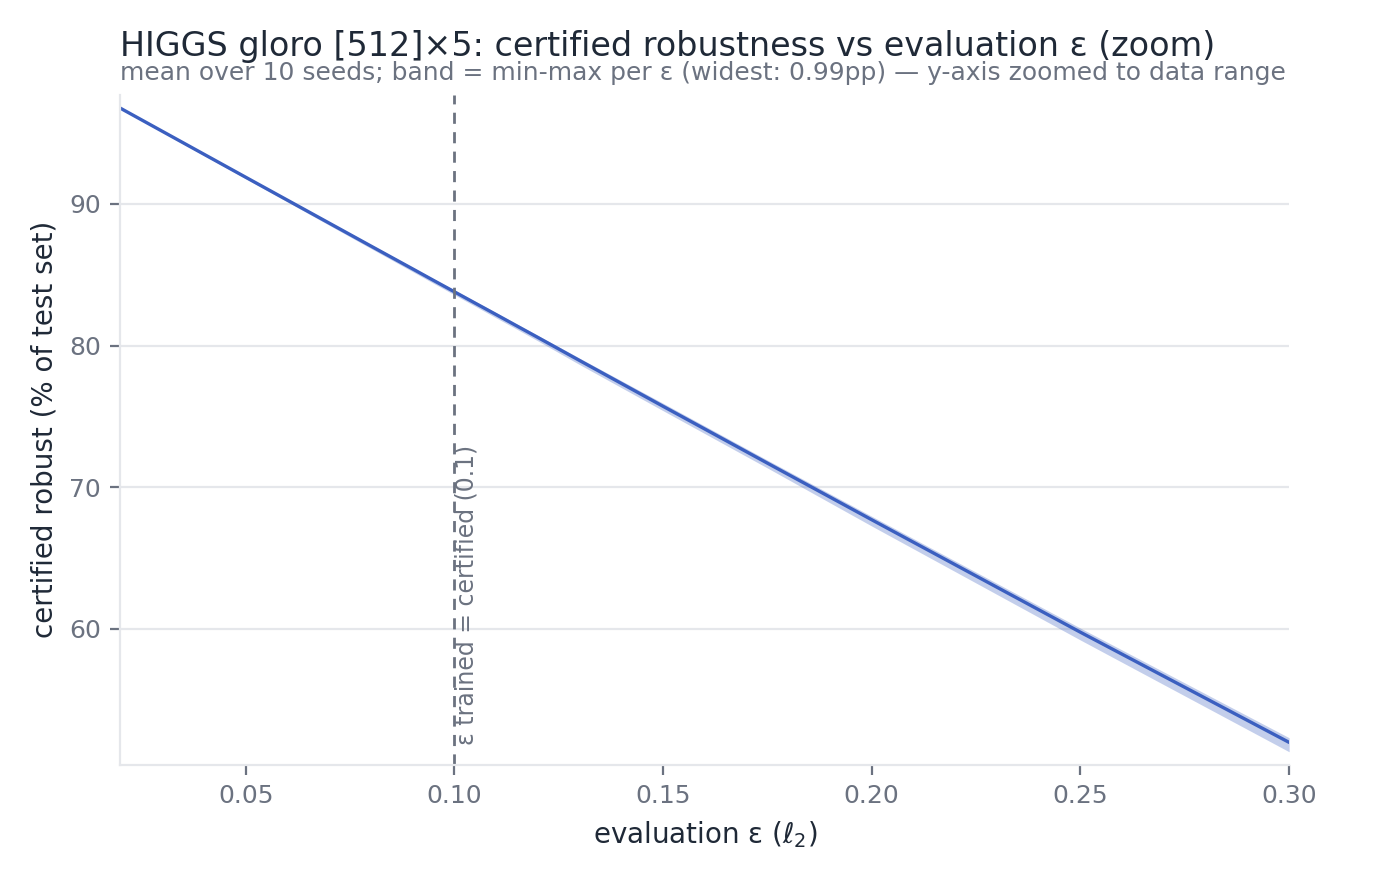
Even zoomed in, the band is a sliver: its widest point on either plot is about 1 percentage point, out at the far tail, and near the designed certification radii it is a few tenths at most. These plots are worth setting against the one built from Le and Cao’s numbers earlier in this post. Besides the widths of the bands (recalling that theirs shows ±1 standard deviation, which if anything understates their seed spread relative to the min-to-max bands here), note the horizontal axes. The absolute ϵ values are not comparable between the two experiments (theirs measure perturbations in l∞ distance, ours in Euclidean distance), but the relative spans are: their largest ϵ is about 1.3 times their smallest—the knife edge discussed earlier—while our largest is 10 times our smallest for MNIST, and 15 times for HIGGS.
In numbers: at no ϵ value we measured, on either task, does the standard deviation of certified robustness across the ten seeds exceed 0.4 percentage points. At the radii the models were designed to be certified at, it is 0.09 percentage points for MNIST (the same dataset where Le and Cao report 28.9) and 0.03 percentage points for HIGGS (against the 11.8 they report for their own binary task). And the amplification at the heart of their paper—that certified robustness varies hundreds of times more than accuracy does—vanishes: at those radii, our certified robustness standard deviations sit within a factor of about two of the corresponding accuracy ones.
In our experiments, then, certified training made the entire curve reproducible across seeds. Note that this is an empirical finding. Underspecification says that properties the training objective ignores are free to vary between retrainings; it does not promise the converse, that properties the objective constrains will vary little.
These results also explain why we chose not to investigate the other question Le and Cao ask, mentioned earlier: whether a “lucky” seed’s certified robustness on one test set carries over to another. With our ten seeds agreeing to within about a tenth of a percentage point, no seed is meaningfully lucky, so there is no luck whose persistence could be tested.
What This Does and Doesn’t Show
First, the question promised earlier: why didn’t we rerun Le and Cao’s own architecture and tasks with certified training? Partly this was by design: their conclusion is about the trustworthiness of the certified robustness numbers that papers in this area report, so the natural place to measure seed variance is in the exact configurations behind such numbers—which is what our two are. And partly it was convenience: we reused the GloRo training and evaluation pipeline from our own papers, and so it made sense to reuse the model architectures and tasks from those papers too. Rerunning Le and Cao’s setup faithfully also did not appear to be an option: unfortunately, their code and data are not available online, so any rerun would have involved guessing at their preprocessing and data splits. Their Mars frost task is not out of reach, though: the underlying dataset is public, and a certified-training experiment on it would be a natural extension for anyone inclined.
Do the differences matter? For architecture, the concern would have to be that convolutional networks are somehow intrinsically less seed-stable than dense ones—that architecture, rather than training, explains the contrast between their results and ours. I know of no evidence for that. Where convolutional networks are measured on a property their training does optimise—accuracy—their seed variance is tiny, in Le and Cao’s own results (0.057 percentage points, on the very models whose certified robustness varied by 28.9) just as in the wider literature. For the tasks, nothing in the mechanism described earlier is specific to a dataset. Their training recipe also differs from ours in smaller ways (e.g., they employ rotation augmentation on the training data and stop training once test accuracy reaches a threshold, neither of which we do) but those differences don’t amount to training for ϵ-ball robustness, which is the distinction that is relevant here. Still, none of these differences has been isolated experimentally, and I cannot rule out surprises.
Our little experiment has further limits. We measured Lipschitz-based certified robustness, not the true robustness a sound-and-complete verifier would measure; whether true robust radii are as seed-stable under certified training is a question our setup cannot answer. And ten seeds on two datasets is hardly the last word.
Finally, nothing here disputes Le and Cao’s measurement in its own regime: standard-trained models really do have wildly seed-dependent certified robustness at knife-edge perturbation sizes. Such measurements have a legitimate use, too: verifying properties of standard-trained models makes for good stress-testing of the verifiers themselves, because near-boundary properties are the hard instances that exercise a solver. Anyone comparing robustness measures on standard-trained models should heed Le and Cao’s warning, since seed variance there can easily swamp the effect being studied. But the robustness claims of the literature live in the other regime, in which models are trained for the property being reported, at perturbation sizes of the same order as those being reported. In that regime, on MNIST—Le and Cao’s headline dataset—the seed variance we measured was about a tenth of a percentage point. So if you report confidence intervals for certified robustness, as Le and Cao rightly ask, I would expect them to be reassuringly boring.
Everything here is reproducible: the scripts for training the models, evaluating them across ϵ values, and producing the plots are all in our repository, alongside the raw per-seed results. If you spot a hole in the experiment, or have run something similar in a regime we haven’t, I’d love to hear about it—please get in touch.
My thanks to Phuong Cao for gracious correspondence about a draft of this post.
In the meantime, thanks for reading.
Notes
[1] A note on terminology, for readers of my Verified Certified Robustness series of posts: in the vocabulary of Part I of that series, α,β-CROWN belongs to the verified robustness line of work—tools that prove robustness by symbolic reasoning over the neural network itself—so the figure it produces would there be called verified robustness. Certified robustness, in that vocabulary, refers to mechanisms that avoid symbolic reasoning over the network entirely, such as the Lipschitz-based checking of Leino et al. or randomised smoothing. Since this post engages closely with Le and Cao’s paper, I follow their usage and say “certified robustness” throughout; the question at issue—how much the figure varies with the training seed—makes sense for either kind. But the two are different measuring instruments, and our own experiments use the certified kind. The terminological traffic runs in both directions, incidentally: Part II is about the ML community calling a certified metric “Verified Robust Accuracy”, and here we have a verifier’s output called “certified robustness”.
[2] The certified robustness of our models is computed by GloRo’s own certification check, which is not necessarily sound. It also fails to account for floating-point rounding, whether in the network being certified or in its own computation of Lipschitz constants. For measuring variance across seeds, as opposed to staking a safety claim on any individual number, that is beside the point.